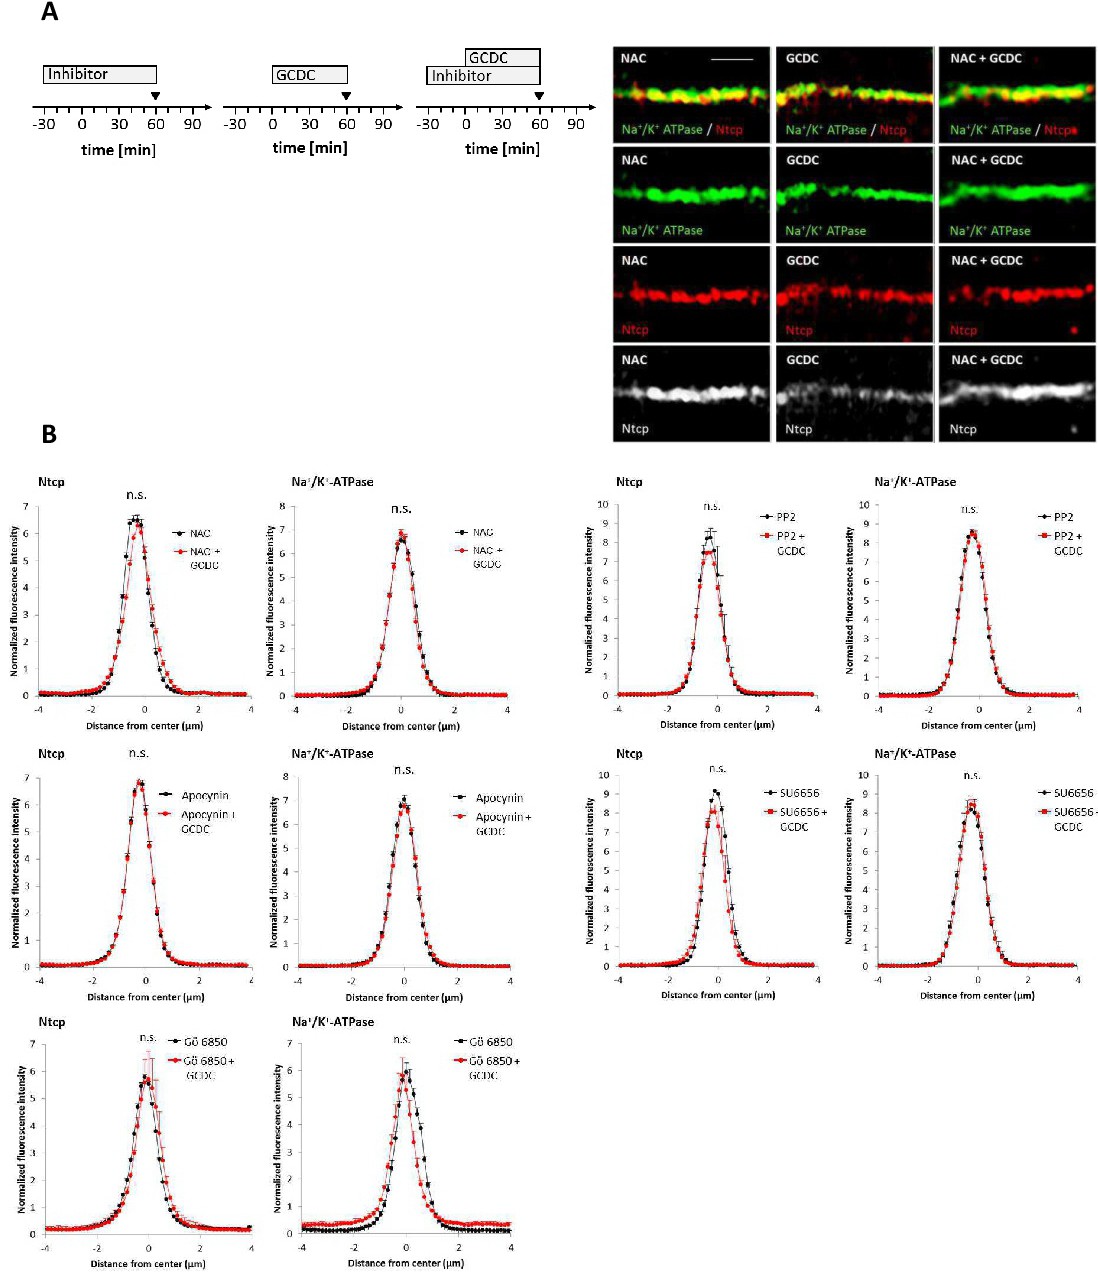
Fig. 4. Effects of GCDC on the subcellular distribution of Ntcp and Na+/K+-ATPase in perfused rat liver. Rat livers were perfused with Krebs-Henseleit buffer with apocynin (20 µmol/l), NAC (10 mmol/l), SU6656 (1 µmol/l), PP-2 (250 nmol/l) or Gö6850(10 µmol/l) in presence or absence of GCDC (20 µmol/l) as indicated in the perfusion plan. (A) Ntcp and Na+/K+-ATPase were visualized after perfusion with either NAC, GCDC or NAC plus GCDC at t = 60 min by SR-SIM. Representative pictures of 3 independent experiments are shown. The scale bar corresponds to 1 µm. (B) Densitometric analysis of fluorescence intensity profiles of Ntcp and Na+/K+-ATPase staining. Data represent arithmetric means ± SEM of at least 10 measurements in each of 3 individual experiments for each condition. Fyn and Yes phosphorylation was quantified by densitometric analysis at t = 90 min (n≥3). * statistically significantly different compared to control. n.s.: not statistically significantly different.